Click here for caption
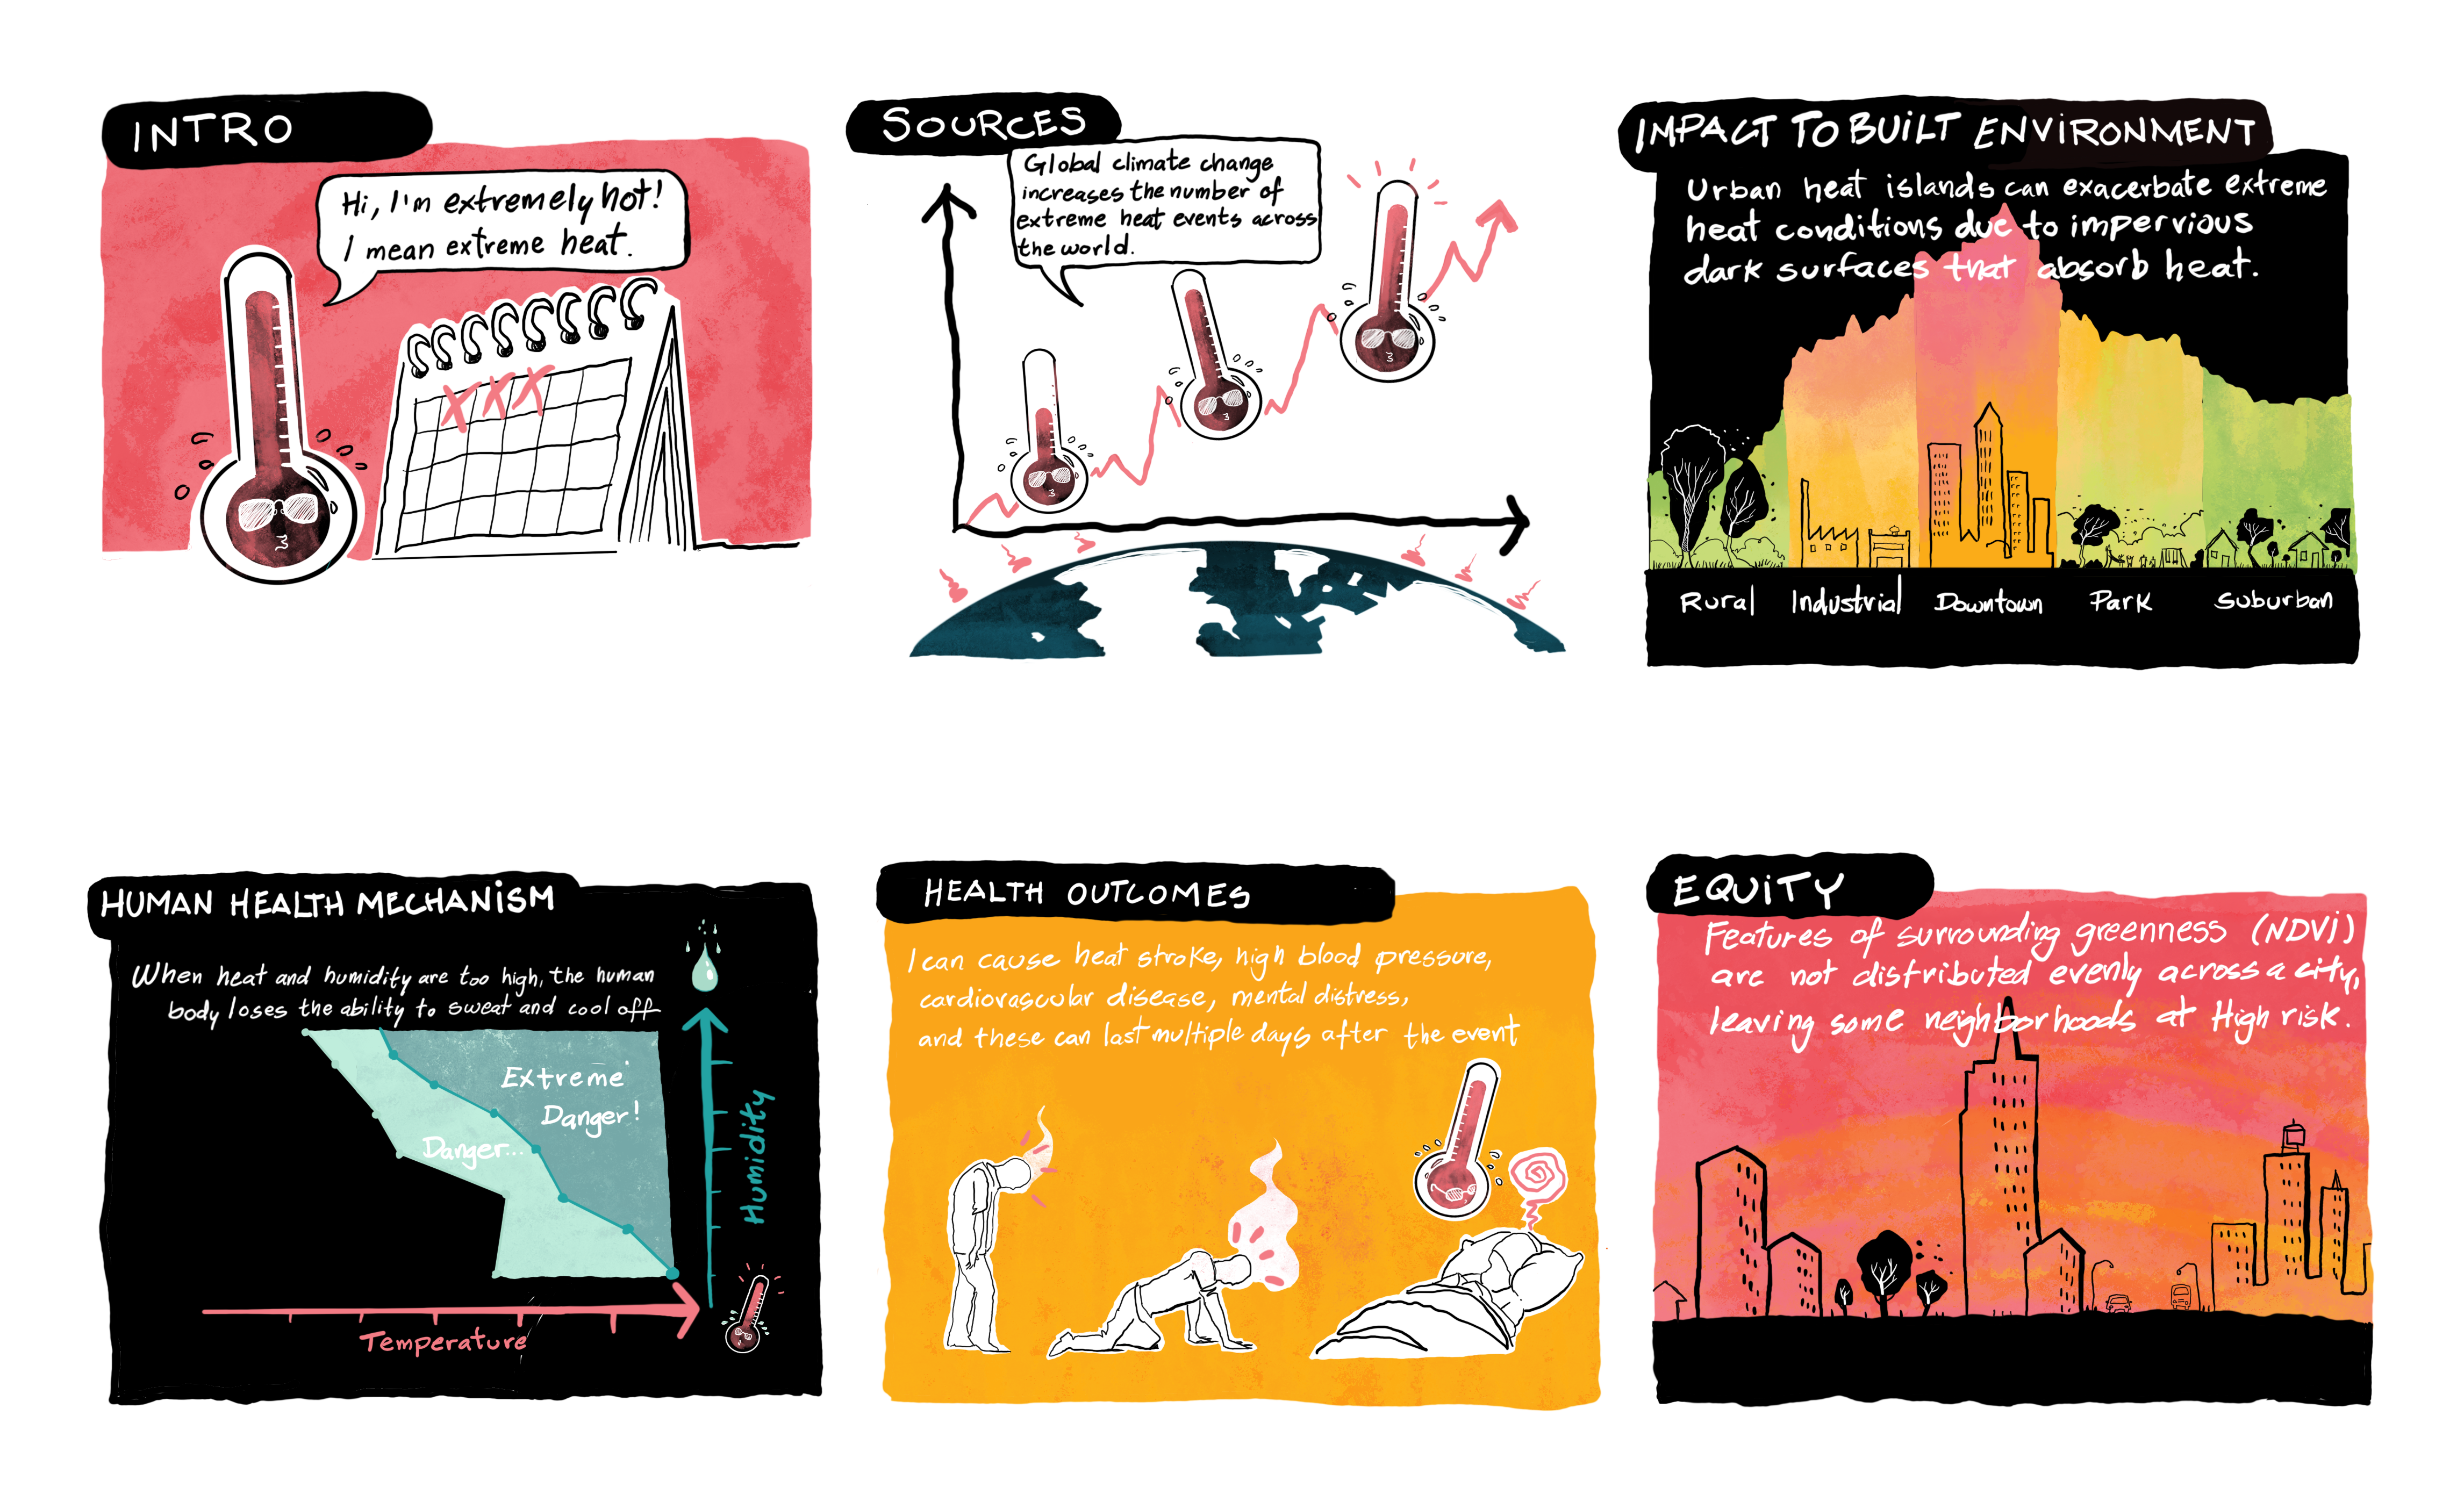
Hi, I’m Extremely Hot (I mean, Extreme Heat). Specifically, I measure two to three consecutive days with temperature and humidity higher than your regional historical average. Sources: Global climate change increases the number of extreme heat events across the world. Exposure: If heat and humidity are too high, the human body begins to lose the ability to sweat, meaning we can no longer cool ourselves off. A wet-bulb temperature tells us the threshold of heat and humidity of human survivability. Outcome: I can cause heat stroke, excess deaths, cardiovascular disease, high blood pressure, and mental distress. And my effects can impact human health for multiple days after an extreme heat event. Built Environment: The built environment often makes me more harmful. Urban heat islands exacerbate extreme heat conditions due to impervious, dark surfaces such as asphalt absorbing heat during the day and releasing it at night. Urban environments also replace natural land cover and vegetation, which tend to cool down local areas due to evapotranspiration from plants. Equity: Urban features such as surrounding greenness (NDVI) can contribute to a wide variety of health issues, such as curbing extreme heat. Since these features are not distributed equally across the city, some neighborhoods are at higher risk of the dangers of extreme heat than others.
Definition
A heat wave, also known as extreme heat, refers to a prolonged spell of exceptionally hot and unusually muggy weather that typically endures for at least two consecutive days, featuring temperatures that exceed the typical historical norms for the specific region. The specific thresholds for defining a “Heat Wave” depend on the location and are determined by the local National Weather Service weather forecast office.
Human Health Mechanism
The human body constantly exchanges heat with the environment, meaning that our body’s homeostatic control system is constantly working to maintain a stable internal body temperature. If heat and humidity levels are too high, we lose our ability to sweat, which is a key mechanism of lowering internal body temperatures. Moreover, because of the added stress that extreme heat events place on our bodies, people who have less ability to adapt (e.g., older or younger individuals, people with chronic diseases, people with physical disabilities) have increased risk of suffering from heat stroke or of experiencing complications from existing conditions.
Indicator Measurement
The US Federal Emergency Management Agency (FEMA) National Risk Index calculates a Heat Wave Risk Index score to represent a community’s relative risk for Heat Waves when compared to the rest of the US. The Heat Wave Risk Index score is based on summing the values of expected building and population loss each year due to heat waves.
Source of Exposures
Related Health Outcomes & Exposures
Cardiovascular Disease, Respiratory Disease, PM2.5, NDVI, Wildfire
References
Click here for References
- Extreme Heat Data Source: Climate Mapping for Resilience and Adaptation (CRMA). US Federal Emergency Management Agency (US FEMA) National Risk Index: Heat Wave. Data year 2021. Accessed April 2023. https://resilience.climate.gov/datasets/FEMA::national-risk-index-census-tracts/about
- Cedeño Laurent JG, Williams A, Oulhote Y, Zanobetti A, Allen JG, Spengler JD. Reduced Cognitive Function during a Heat Wave among Residents of non-air-conditioned buildings: an Observational Study of Young Adults in the Summer of 2016. Patz JA, ed. PLOS Medicine. 2018;15(7):e1002605. doi:10.1371/journal.pmed.1002605
- ChoiEY, Lee H, ChangCumulative exposure to extreme heat and trajectories of cognitive decline among older adults in the USA. J Epidemiol Community Health 2023;77:728-735.
- Cramer MN, Gagnon D, Laitano O, Crandall CG. Human temperature regulation under heat stress in health, disease, and injury. Physiol Rev. 2022;102(4):1907-1989. doi:10.1152/physrev.00047.2021
- Ellena M, Breil M, Soriani S. The Heat-Health Nexus in the Urban context: a Systematic Literature Review Exploring the socio-economic Vulnerabilities and Built Environment Characteristics. Urban Climate. 2020;34:100676. doi:10.1016/j.uclim.2020.100676
- Haverinen-Shaughnessy U, Shaughnessy RJ. Effects of Classroom Ventilation Rate and Temperature on Students’ Test Scores. PLoS One. 2015;10(8):e0136165. Published 2015 Aug 28. doi:10.1371/journal.pone.0136165
- Mora C, Dousset B, Caldwell IR, et al. Global risk of deadly heat. Nature Climate Change. 2017;7(7):501-506. doi:10.1038/nclimate3322
- Ndugga N, Artiga S. Continued Rises in Extreme Heat and Implications for Health Disparities. KFF.org. Published August 24, 2023. Accessed November 17, 2023. https://www.kff.org/racial-equity-and-health-policy/issue-brief/continued-rises-in-extreme-heat-and-implications-for-health-disparities/
- US FEMA. National Risk Index: Heat Wave. March 2023. hazards.fema.gov. Accessed November 10, 2023. https://hazards.fema.gov/nri/heat-wave
- Williams AA, Spengler JD, Catalano P, Allen JG, Cedeno-Laurent JG. Building Vulnerability in a Changing Climate: Indoor Temperature Exposures and Health Outcomes in Older Adults Living in Public Housing during an Extreme Heat Event in Cambridge, MA. Int J Environ Res Public Health. 2019;16(13):2373. Published 2019 Jul 4. doi:10.3390/ijerph16132373