Click here for caption
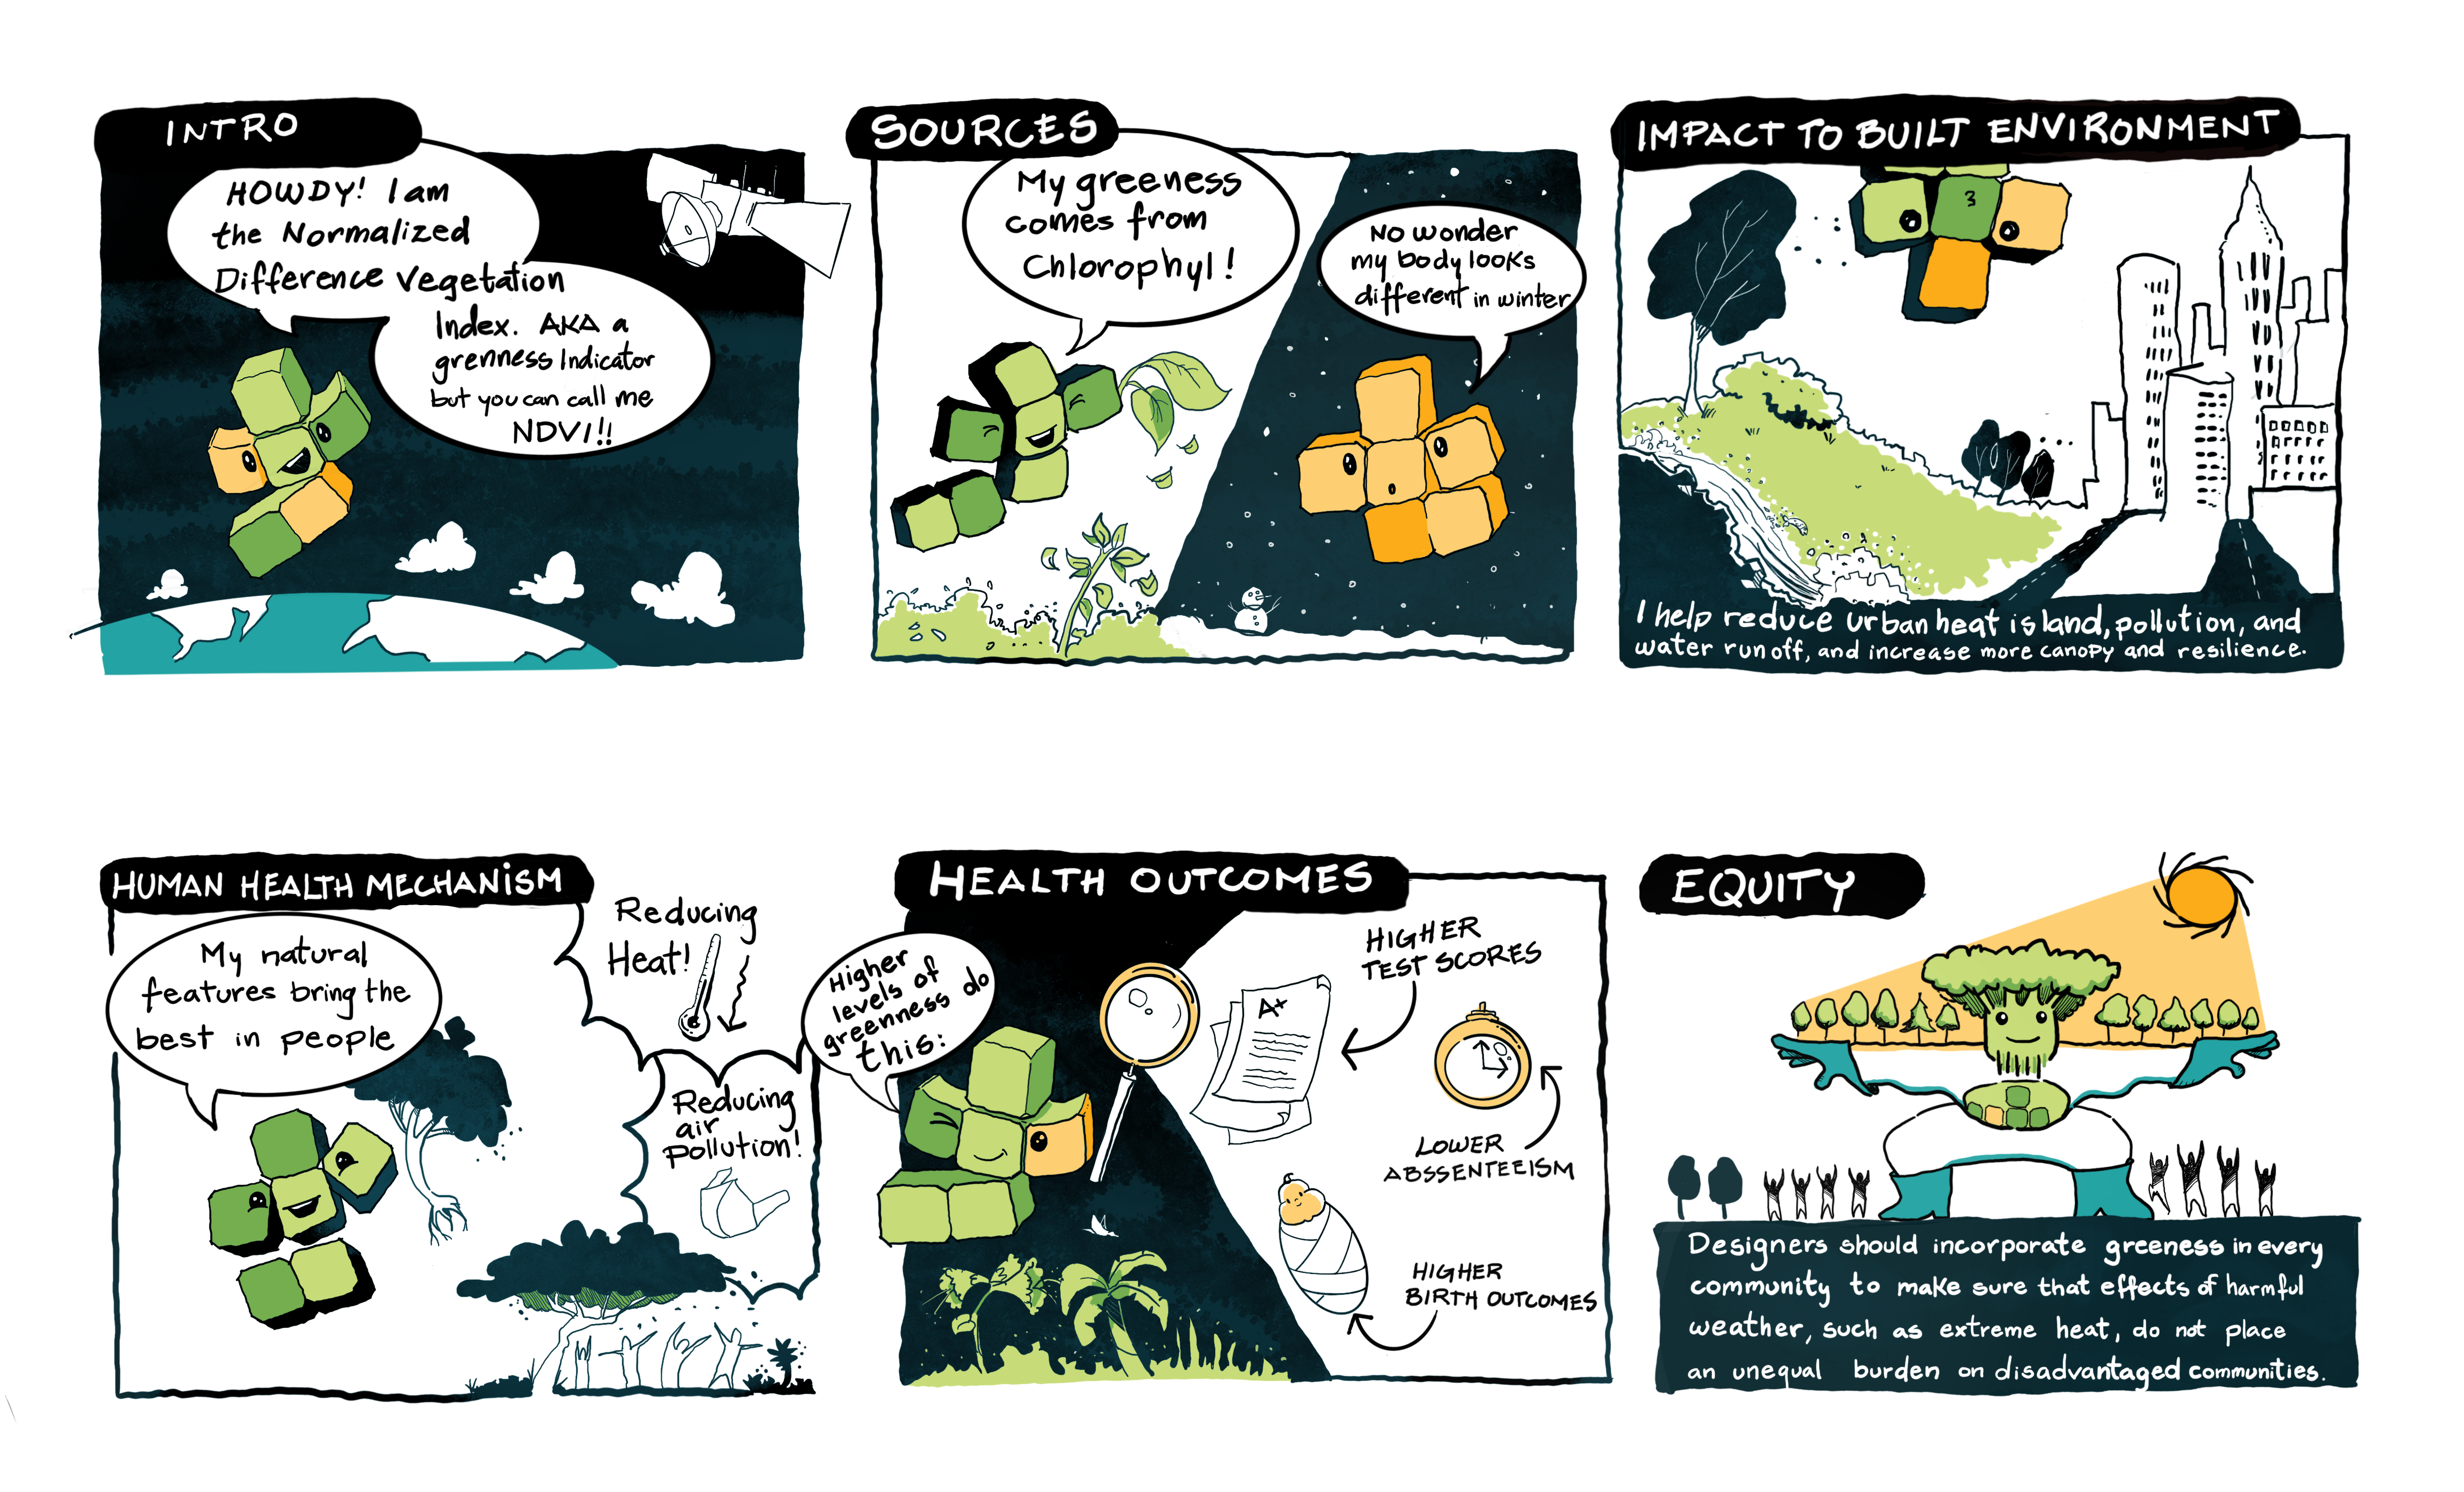
Howdy, I’m the Normalized Difference Vegetation Index, but only my mother calls me that, you can just call me ‘NDVI’. I’m here to tell you how green your surroundings are! Satellites measure me from space to capture seasonal differences in greenness. My greenness comes from anything with chlorophyll, a small grassy patch to large bushes and trees. The greener plants the higher my NDVI value, no wonder my winter body looks different than my summer body. My natural features bring out the best in people by improving psychological and physical health outcomes by reducing heat, air pollution and exposing people to nature. I can detect public or private green spaces, but I cannot tell you their quality. Higher levels of greenness have been associated with higher birth outcomes and student performance including higher test scores and lower chronic absenteeism as well decrease all-cause mortality. A high NDVI value helps reduce urban heat island, pollution and water runoff, and increase tree canopy and resilience. More trees and plants may also mean more maintenance. Inequities in the amount of surrounding greenness creates an environment where even within the same city, one neighborhood is several degrees hotter than another one. To make sure that the effects of harmful weather, such as extreme heat, do not place an unequal burden on disadvantaged communities, designers should incorporate strategies to increase greenness in every community.
Definition
The NDVI is the most common metric to estimate the quantity of green vegetation in census tracts and zip codes. NDVI produces an index value ranging from minus one (-1) to plus one (+1). A NDVI value of zero means no vegetation, and an NDVI value approaching +1 (i.e., 0.8 – 0.9) indicates the highest possible density of green leaves.Human Health Mechanism
Increased greenness in spaces can promote positive community health outcomes and reduced mortality. Increased access to green spaces and parks can create connections to nature, increase opportunities for physical activity, promote social cohesion and community connections, and reduce stress and improve mental health. Adding green spaces, like parks and trails, can reduce the risk of illness and injury by providing safe spaces for people to play and exercise. Furthermore, increased greenness can mitigate the effects of heat and noise in urban areas and reduce air and water pollutants.Indicator Measurement
US Geological Survey (USGS) uses zonal statistics and takes an average of NDVI value in every boundary.Source of Exposures
There are many different indicators for greenness in an area. Greenness includes green vegetation, like shrubs, tree and canopy covers, grasslands, and rainforests. Furthermore, green spaces can include public parks, undeveloped or open land, forests, and nature reserves.Related Health Outcomes & Exposures
Extreme heat, PM2.5, Cardiovascular Health, Mental Health, Walkability, FloodingReferences
Click here for References
- NDVI Data Source: USGS. Earth Explorer. 2019. Accessed: April 2023. https://earthexplorer.usgs.gov/
- Brittin J, Sorensen D, Trowbridge M, et al. Physical activity design guidelines for school architecture. PLOS ONE. 2015;10(7). doi:10.1371/journal.pone.0132597
- Brochu P, Jimenez MP, James P, Kinney PL, Lane K. Benefits of Increasing Greenness on All-Cause Mortality in the Largest Metropolitan Areas of the United States Within the Past Two Decades. Front Public Health. 2022;10. Accessed October 15, 2023. https://www.frontiersin.org/articles/10.3389/fpubh.2022.841936
- Center for Disease Control and Prevention (CDC). Physical Activity: Parks, Recreation, and Green Spaces. www.cdc.gov. Published March 16, 2022. Accessed October 15, 2023. https://www.cdc.gov/physicalactivity/activepeoplehealthynation/everyone-can-be-involved/parks-recreation-and-green-spaces.html
- James P, Banay RF, Hart JE, Laden F. A Review of the Health Benefits of Greenness. Curr Epidemiol Rep. 2015;2(2):131-142. doi:10.1007/s40471-015-0043-7
- Jimenez MP, DeVille NV, Elliott EG, et al. Associations between Nature Exposure and Health: A Review of the Evidence. Int J Environ Res Public Health. 2021;18(9):4790. Published 2021 Apr 30. doi:10.3390/ijerph18094790
- Vilcins D, Sly PD, Scarth P, Mavoa S. Green space in health research: An overview of common indicators of greenness. Rev Environ Health. Published online November 14, 2022. doi:10.1515/reveh-2022-0083
