Click here for caption
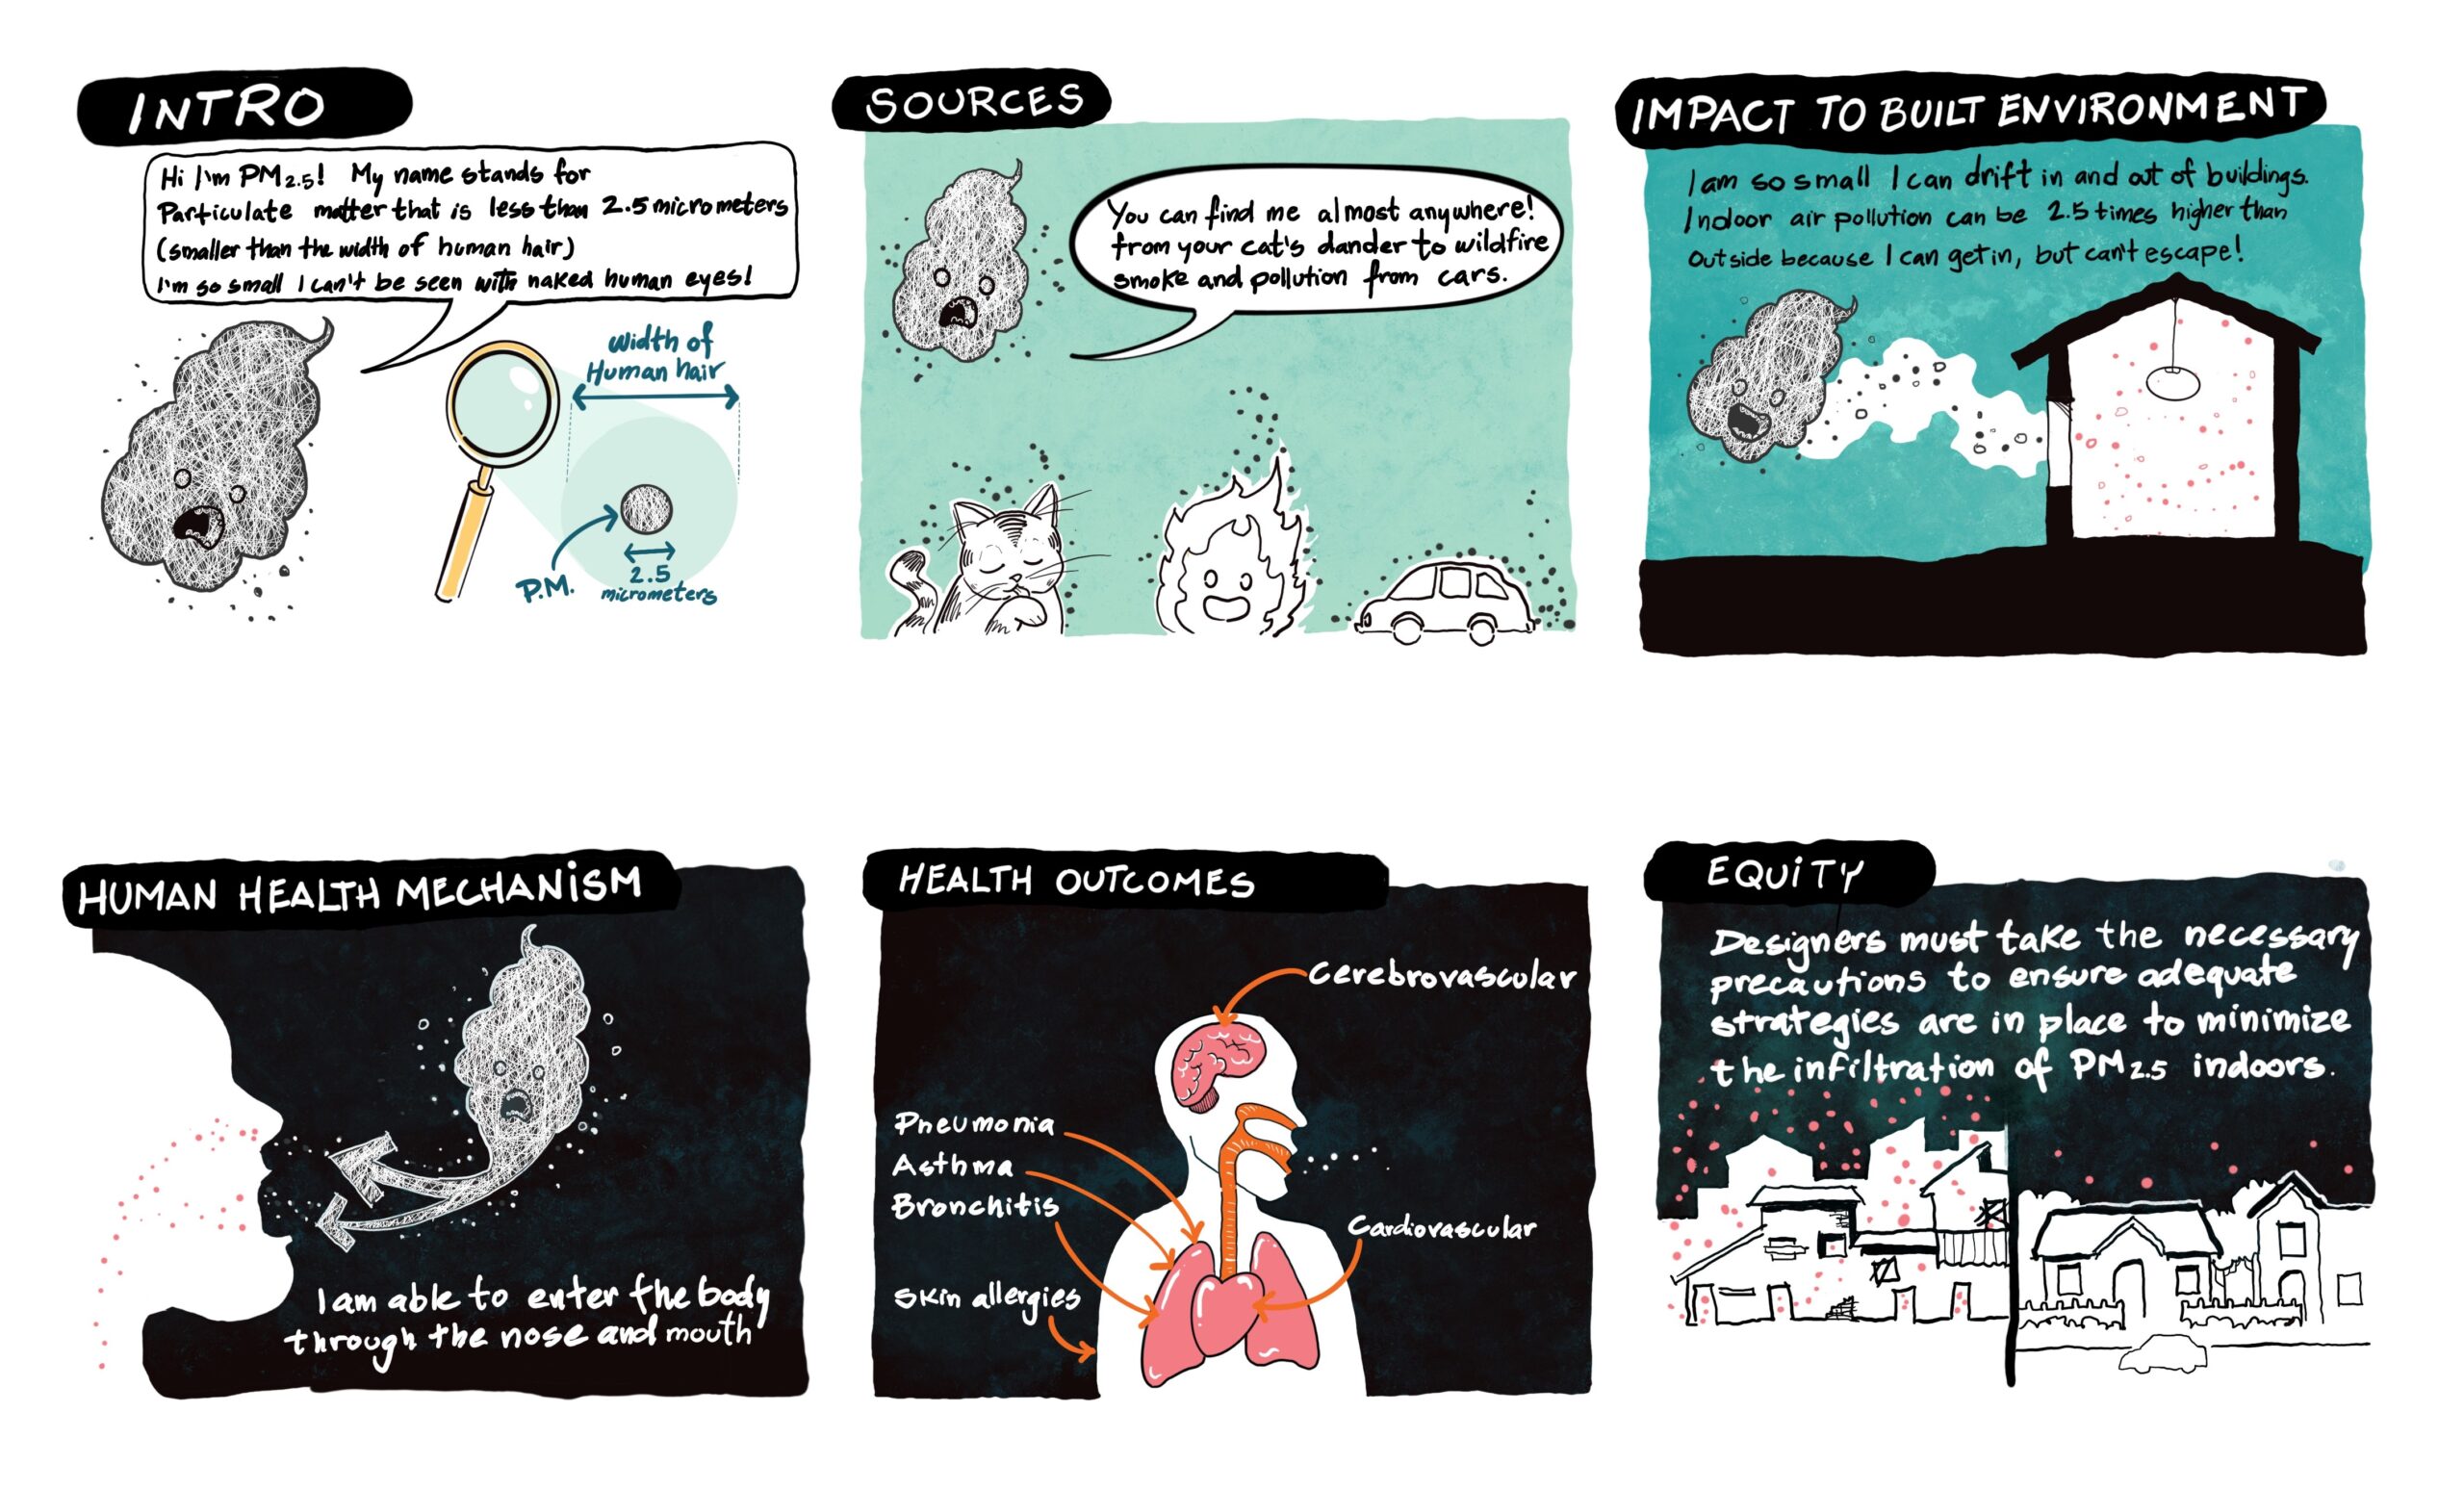
Hi, I’m PM2.5! My name stands for Particulate Matter that are less than 2.5 micrometers (smaller than the width of a human hair!) so I’m extremely small and can’t be seen with naked, human eyes. You can find me almost everywhere from your cat’s dander to wildfire smoke and pollution from cars. My size is so small that I can drift in and out of buildings. This means that when the PM2.5 levels are high outside, they are also high inside. I am able to enter the body through the nose and mouth and travel through the bloodstream, causing diseases in multiple organs, such as your heart and lungs. Getting exposed to PM2.5 and developing a serious illness because of it are more likely for low-income communities of color in the U.S. When designing our buildings, designers must take necessary precautions to ensure that adequate strategies are put in place to minimize the infiltration of PM2.5 indoors.
Definition
PM stands for particulate matter and 2.5 indicates the size of the particle, in this case, 2.5 microns in size. PM2.5 is a measure of the concentration of inhalable particles that are 2.5 micrometers or smaller, which can enter our bodies through airways and deposit into the deep lungs and even travel into the bloodstream. The concentration of PM2.5 is measured by the annual average concentration in air in micrograms per cubic meter (µg/m3). Nationally, PM2.5 concentrations have decreased more than 35% in the last two decades due to environmental policies and regulations.
Human Health Mechanism
Exposure to PM2.5 can affect both our respiratory and circulatory systems because the particles are small enough to migrate from the nose and mouth into the deep lungs and bloodstream. Due to this mechanism, elevated acute and chronic exposure to PM2.5 may have numerous impacts on health, including exacerbating asthma, contributing to heart attacks, decreasing lung function, and additional acute respiratory systems (throat irritation, coughing, and difficulty breathing).
Indicator Measurement
Data on PM2.5 are provided by the US Environmental Protection Agency’s (US EPA) EJScreen, an environmental justice screening tool that uses national data to map places that are more vulnerable and susceptible to environmental burdens. The PM2.5 indicator data are provided by US EPA Office of Air Quality Planning and Standards (OAQPS) using a mix of actual monitoring results and Community Multiscale Air Quality (CMAQ) air quality modeling. USEPA’s EJScreen presents the PM2.5 concentration by census tract to measure of potential exposure to inhalable particles that are 2.5 microns, or smaller. Because the PM2.5 indicator is an annual average, this indicator does not provide information on maximum daily exposure, seasonal differences or acute events (e.g. smoke from wildfires, July 4th fireworks).
Source of Exposures
PM2.5 is an important component of air pollution and can be produced by various of manmade and natural sources including, traffic exhaust, construction sites, industrial sites, power generation, smokestacks, and fires.
Related Health Outcomes & Exposures
Ozone, Traffic Proximity, Extreme HeatReferences
Click here for References
- Particulate Matter Data Source: US EPA. EJScreen: Particulate matter 2.5. Data year 2019. Retrieved April 2023 from https://www.epa.gov/ejscreen/download-ejscreen-data
- US EPA. Overview of Environmental Indicators in EJSCREEN. US EPA. Updated July 25, 2023. https://www.epa.gov/ejscreen/overview-environmental-indicators-ejscreen
- US EPA. EJScreen Technical Documentation for Version 2.2. Updated July 2023. Accessed November 21, 2023. https://www.epa.gov/ejscreen/technical-information-about-ejscreen#:~:text=EJScreen%20Technical%20Documentation%20(pdf)
- US EPA. Progress Cleaning the Air and Improving People’s Health | US EPA. US EPA. Published March 14, 2019. https://www.epa.gov/clean-air-act-overview/progress-cleaning-air-and-improving-peoples-health
- US EPA. AirNow. Airnow.gov. Originally published 2010. https://www.airnow.gov/
- Xing YF, Xu YH, Shi MH, Lian YX. The impact of PM2.5 on the human respiratory system. J Thorac Dis. 2016;8(1):E69-E74. doi:10.3978/j.issn.2072-1439.2016.01.19